Strategy Tester Report
AlpariUK-Demo (Build 225)
| Symbol | USDJPY (US Dollar vs Japanese Yen) | ||||
| Period | 1 Hour (H1) 2009.11.03 02:00 - 2009.11.27 22:00 (2009.11.01 - 2009.11.30) | ||||
| Model | Every tick (the most precise method based on all available least timeframes) | ||||
| Parameters | Confirm=1; length1=3; length2=10; length3=16; lots=0.1; TakeProfit=0; StopLoss=0; UseTrail=false; TrailingAct=10; TrailingStep=40; UseADX=false; ADXthresh=30; UseTimeFilter=false; BeginHour=8; EndHour=18; Reverse=false; | ||||
| Bars in test | 551 | Ticks modelled | 541880 | Modelling quality | n/a |
| Mismatched charts errors | 113 | ||||
| Initial deposit | 10000.00 | ||||
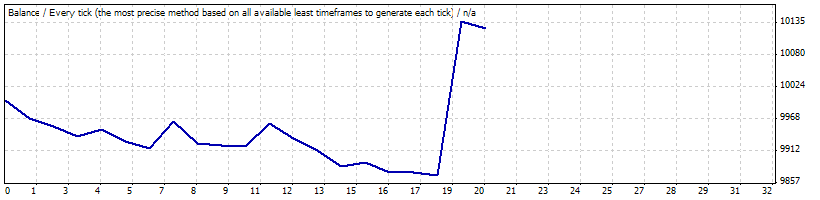
| Total net profit | 126.06 | Gross profit | 375.43 | Gross loss | -249.37 |
| Profit factor | 1.51 | Expected payoff | 6.30 | ||
| Absolute drawdown | 166.87 | Maximal drawdown | 243.66 (2.35%) | Relative drawdown | 2.35% (243.66) |
| Total trades | 20 | Short positions (won %) | 10 (50.00%) | Long positions (won %) | 10 (10.00%) |
| Profit trades (% of total) | 6 (30.00%) | Loss trades (% of total) | 14 (70.00%) | ||
| Largest | profit trade | 268.09 | loss trade | -37.71 | |
| Average | profit trade | 62.57 | loss trade | -17.81 | |
| Maximum | consecutive wins (profit in money) | 1 (268.09) | consecutive losses (loss in money) | 3 (-75.70) | |
| Maximal | consecutive profit (count of wins) | 268.09 (1) | consecutive loss (count of losses) | -75.70 (3) | |
| Average | consecutive wins | 1 | consecutive losses | 2 | |
| # | Time | Type | Order | Size | Price | S / L | T / P | Profit | Balance |
| 1 | 2009.11.03 09:00 | sell | 1 | 0.10 | 90.057 | 0.000 | 0.000 | ||
| 2 | 2009.11.03 17:00 | close | 1 | 0.10 | 90.345 | 0.000 | 0.000 | -31.88 | 9968.12 |
| 3 | 2009.11.03 17:00 | buy | 2 | 0.10 | 90.346 | 0.000 | 0.000 | ||
| 4 | 2009.11.04 06:00 | close | 2 | 0.10 | 90.226 | 0.000 | 0.000 | -13.26 | 9954.86 |
| 5 | 2009.11.04 06:00 | sell | 3 | 0.10 | 90.225 | 0.000 | 0.000 | ||
| 6 | 2009.11.04 07:00 | close | 3 | 0.10 | 90.380 | 0.000 | 0.000 | -17.15 | 9937.71 |
| 7 | 2009.11.04 07:00 | buy | 4 | 0.10 | 90.381 | 0.000 | 0.000 | ||
| 8 | 2009.11.05 04:00 | close | 4 | 0.10 | 90.485 | 0.000 | 0.000 | 11.62 | 9949.34 |
| 9 | 2009.11.05 04:00 | sell | 5 | 0.10 | 90.486 | 0.000 | 0.000 | ||
| 10 | 2009.11.05 20:00 | close | 5 | 0.10 | 90.676 | 0.000 | 0.000 | -20.95 | 9928.39 |
| 11 | 2009.11.05 20:00 | buy | 6 | 0.10 | 90.675 | 0.000 | 0.000 | ||
| 12 | 2009.11.06 10:00 | close | 6 | 0.10 | 90.564 | 0.000 | 0.000 | -12.22 | 9916.17 |
| 13 | 2009.11.06 10:00 | sell | 7 | 0.10 | 90.563 | 0.000 | 0.000 | ||
| 14 | 2009.11.06 15:00 | close | 7 | 0.10 | 90.140 | 0.000 | 0.000 | 46.93 | 9963.10 |
| 15 | 2009.11.06 15:00 | buy | 8 | 0.10 | 90.141 | 0.000 | 0.000 | ||
| 16 | 2009.11.12 06:00 | close | 8 | 0.10 | 89.800 | 0.000 | 0.000 | -37.71 | 9925.39 |
| 17 | 2009.11.12 06:00 | sell | 9 | 0.10 | 89.791 | 0.000 | 0.000 | ||
| 18 | 2009.11.12 09:00 | close | 9 | 0.10 | 89.815 | 0.000 | 0.000 | -2.67 | 9922.72 |
| 19 | 2009.11.12 09:00 | buy | 10 | 0.10 | 89.813 | 0.000 | 0.000 | ||
| 20 | 2009.11.13 11:00 | close | 10 | 0.10 | 89.782 | 0.000 | 0.000 | -3.41 | 9919.32 |
| 21 | 2009.11.13 11:00 | sell | 11 | 0.10 | 89.783 | 0.000 | 0.000 | ||
| 22 | 2009.11.17 17:00 | close | 11 | 0.10 | 89.410 | 0.000 | 0.000 | 41.57 | 9960.88 |
| 23 | 2009.11.17 17:00 | buy | 12 | 0.10 | 89.412 | 0.000 | 0.000 | ||
| 24 | 2009.11.18 08:00 | close | 12 | 0.10 | 89.179 | 0.000 | 0.000 | -26.09 | 9934.80 |
| 25 | 2009.11.18 08:00 | sell | 13 | 0.10 | 89.183 | 0.000 | 0.000 | ||
| 26 | 2009.11.18 18:00 | close | 13 | 0.10 | 89.380 | 0.000 | 0.000 | -22.04 | 9912.76 |
| 27 | 2009.11.18 18:00 | buy | 14 | 0.10 | 89.382 | 0.000 | 0.000 | ||
| 28 | 2009.11.19 06:00 | close | 14 | 0.10 | 89.135 | 0.000 | 0.000 | -27.58 | 9885.18 |
| 29 | 2009.11.19 06:00 | sell | 15 | 0.10 | 89.138 | 0.000 | 0.000 | ||
| 30 | 2009.11.20 16:00 | close | 15 | 0.10 | 89.080 | 0.000 | 0.000 | 6.43 | 9891.61 |
| 31 | 2009.11.20 16:00 | buy | 16 | 0.10 | 89.079 | 0.000 | 0.000 | ||
| 32 | 2009.11.23 02:00 | close | 16 | 0.10 | 88.928 | 0.000 | 0.000 | -16.94 | 9874.68 |
| 33 | 2009.11.23 02:00 | sell | 17 | 0.10 | 88.940 | 0.000 | 0.000 | ||
| 34 | 2009.11.23 04:00 | close | 17 | 0.10 | 88.933 | 0.000 | 0.000 | 0.79 | 9875.47 |
| 35 | 2009.11.23 04:00 | buy | 18 | 0.10 | 88.939 | 0.000 | 0.000 | ||
| 36 | 2009.11.24 04:00 | close | 18 | 0.10 | 88.890 | 0.000 | 0.000 | -5.47 | 9870.00 |
| 37 | 2009.11.24 04:00 | sell | 19 | 0.10 | 88.889 | 0.000 | 0.000 | ||
| 38 | 2009.11.27 15:00 | close | 19 | 0.10 | 86.565 | 0.000 | 0.000 | 268.09 | 10138.09 |
| 39 | 2009.11.27 15:00 | buy | 20 | 0.10 | 86.566 | 0.000 | 0.000 | ||
| 40 | 2009.11.27 22:59 | close at stop | 20 | 0.10 | 86.462 | 0.000 | 0.000 | -12.03 | 10126.06 |